A Web-Based Dashboard of Monthly Metrics Keeps a Company on Track
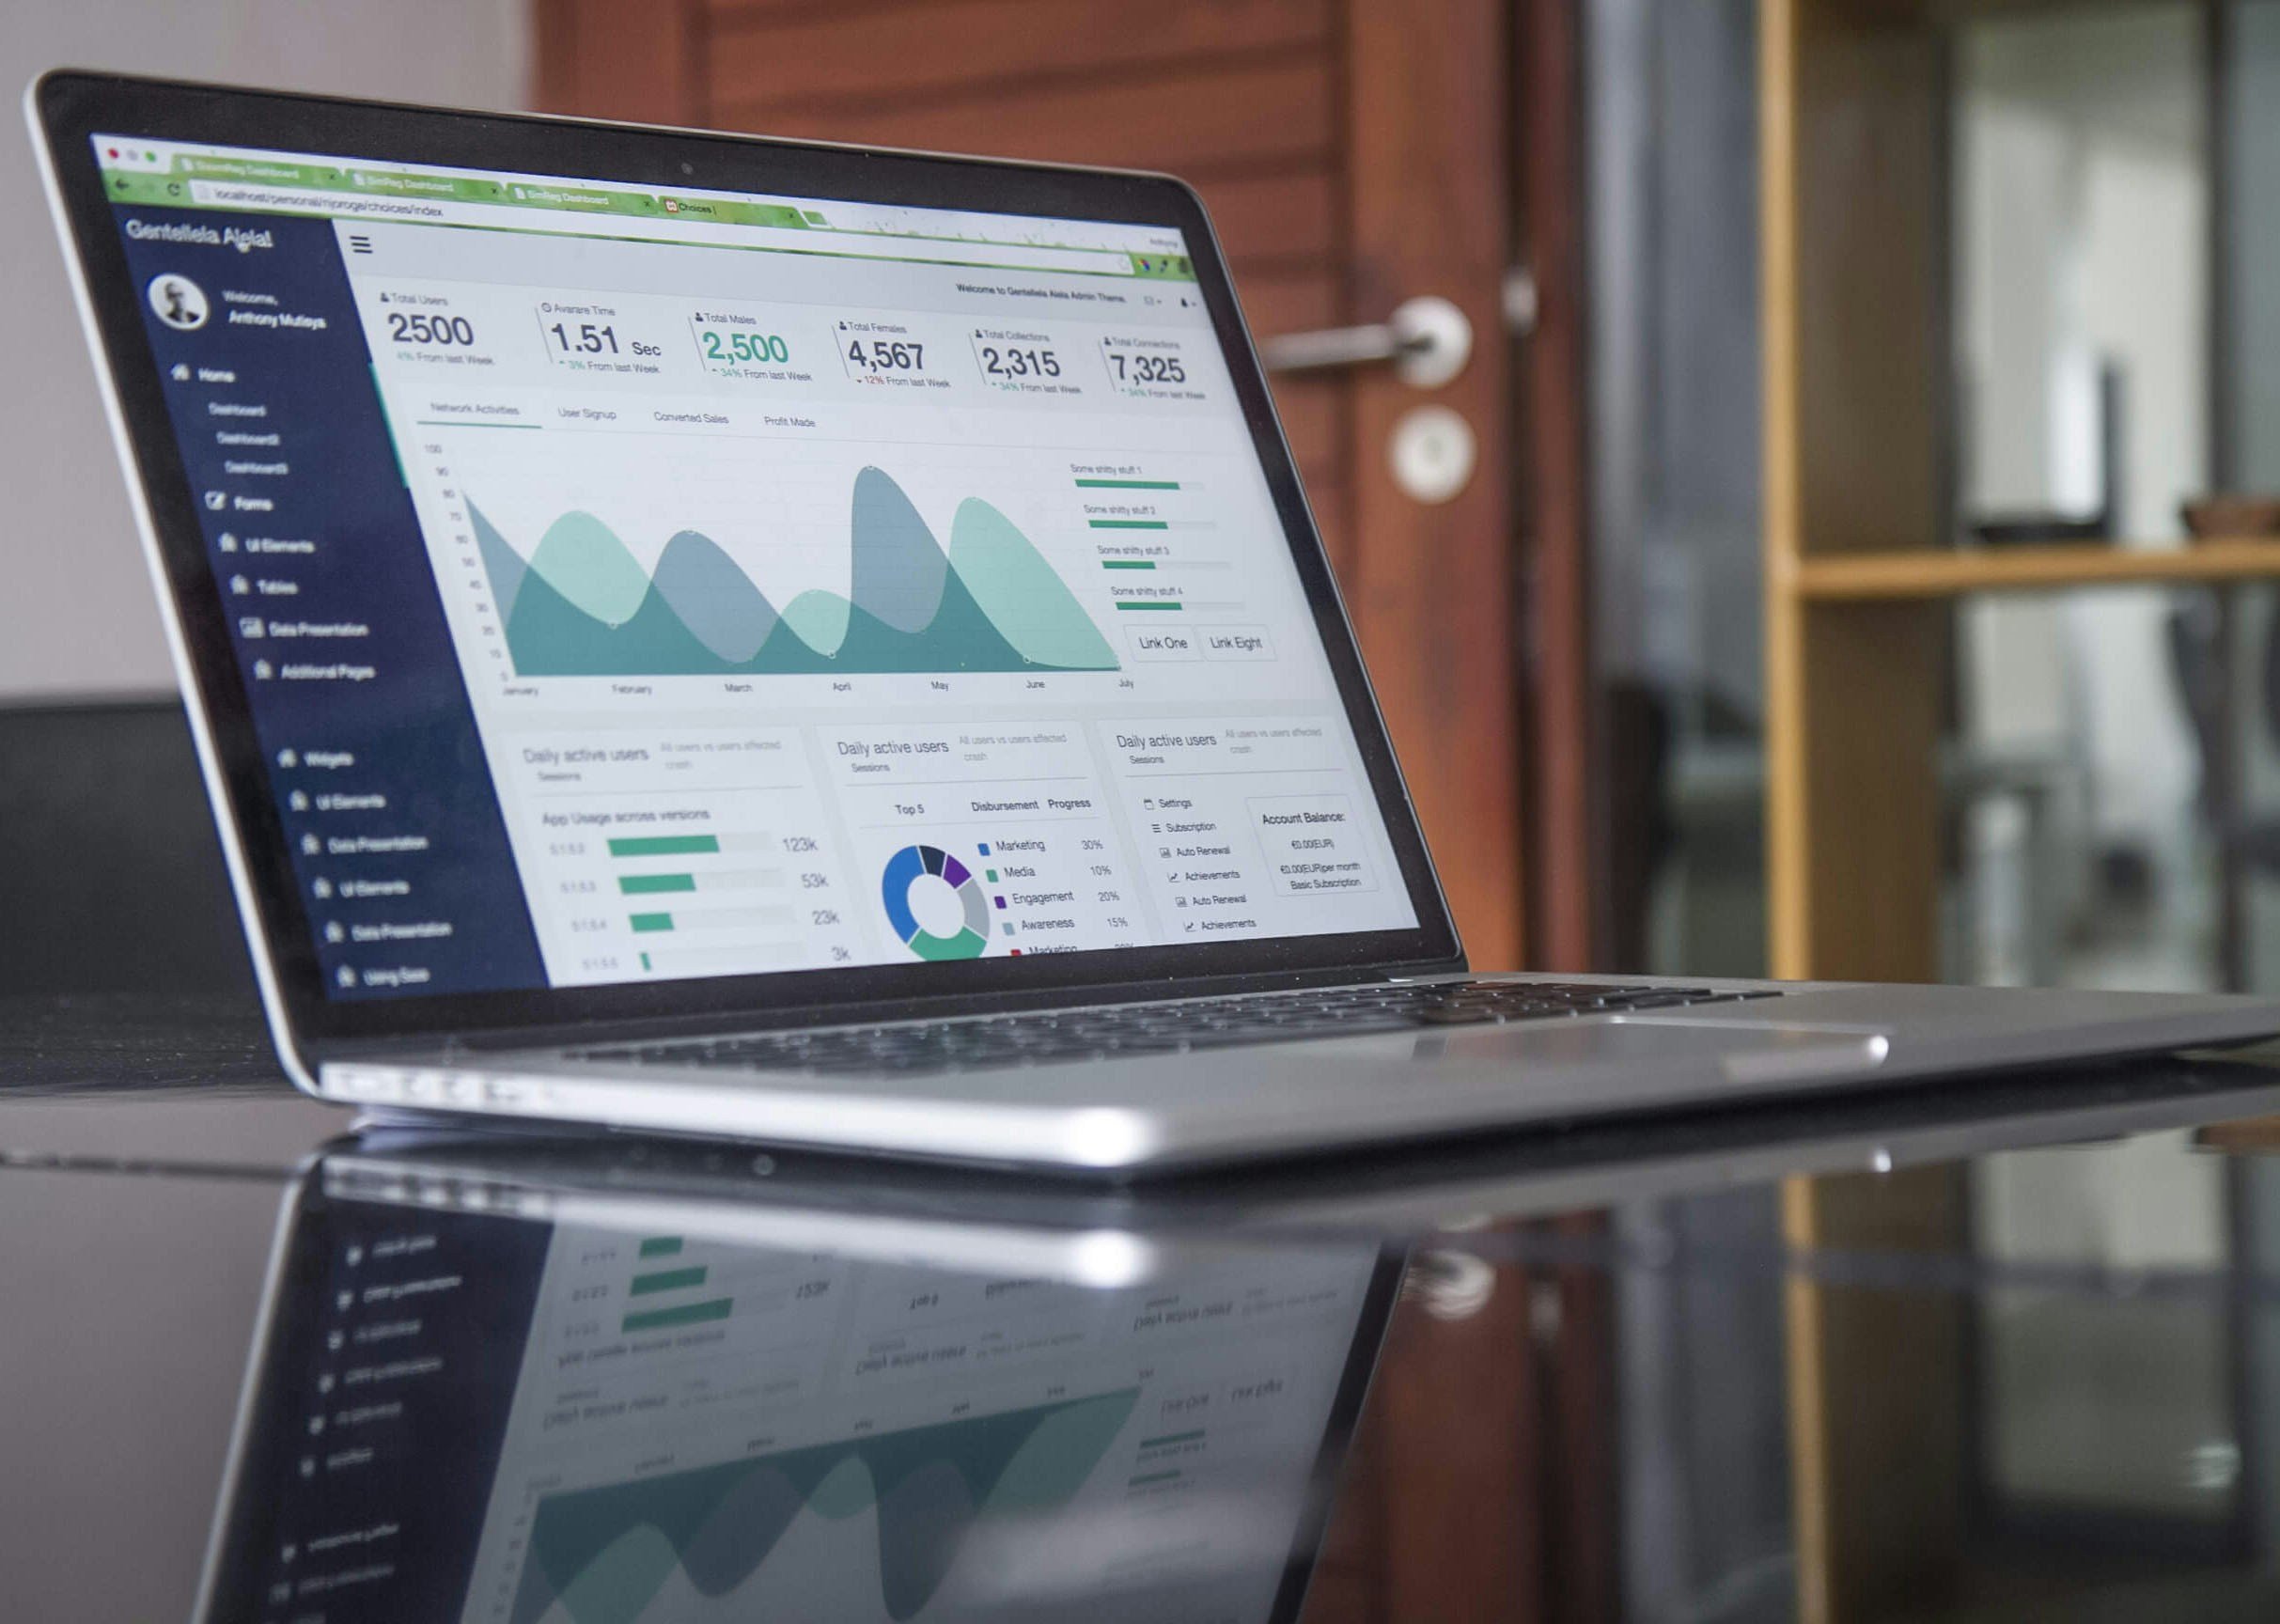
We worked with a leadership team that had reams of data about how its team operates day-to-day. What they didn’t have was the data that connected the dots about what actually matters.
The data weren’t helping them answer the critical question: how are we doing?
Every organization needs to track key data, but many clients struggle to identify which ones actually narrate a story. Furthermore, many of these reports are stale, outdated and time consuming to generate, failing to provide the insight they promise.
So we helped them determine the most compelling Key Performance Indicators (KPIs) and metrics they needed to know to monitor and diagnose their performance. The data points that show what’s really happening in their organization.
We built an application that captured the data they needed to meet their goals. An interactive, web-based data dashboard that shows data in easily consumable charts and graphs, giving executives real-time access to the critical information they need.
If you’re an organization who is tracking data but lacking the narrative or an interactive dashboard, let’s talk. Because as the saying goes, “in God we trust, but all others must bring data.”